For measuring the evolution of compute resource consumption of a specific process over time I typically use goeffel. I wrote that at Mesosphere a couple of years back for custom internal needs.
Recently, I tried to see if I can reproduce a memory leak in conbench. This here is a quick demonstration of how I used goeffel to do that. Specifically, I used goeffel to measure the Resident set size (RSS) of a web application process over time.
To observe the target process from the get-go, first invoke goeffel:
# goeffel --pid-command 'pgrep gunicorn --newest'
Now, goeffel waits for the to-be-observed process to pop up (gunicorn in this case). Once goeffel discovers the process to monitor, it starts doing its thing (and by default that means that it measures the RSS). You will see log messages like
Updated HDF5 file: wrote 20 sample(s) in 0.02304 s
confirming that data is constantly acquired and persisted to disk.
You can then use goeffel-analysis to generate plots from the data (this works while goeffel is still running):
goeffel-analysis plot goeffel-timeseries__20230601-113800.hdf5
This writes PNG files (when you invoke it with --interactive-plot you can use the matplotlib GUI to explore and change the plot interactively, and of course also to save figures).
By default, a plot may look like this:
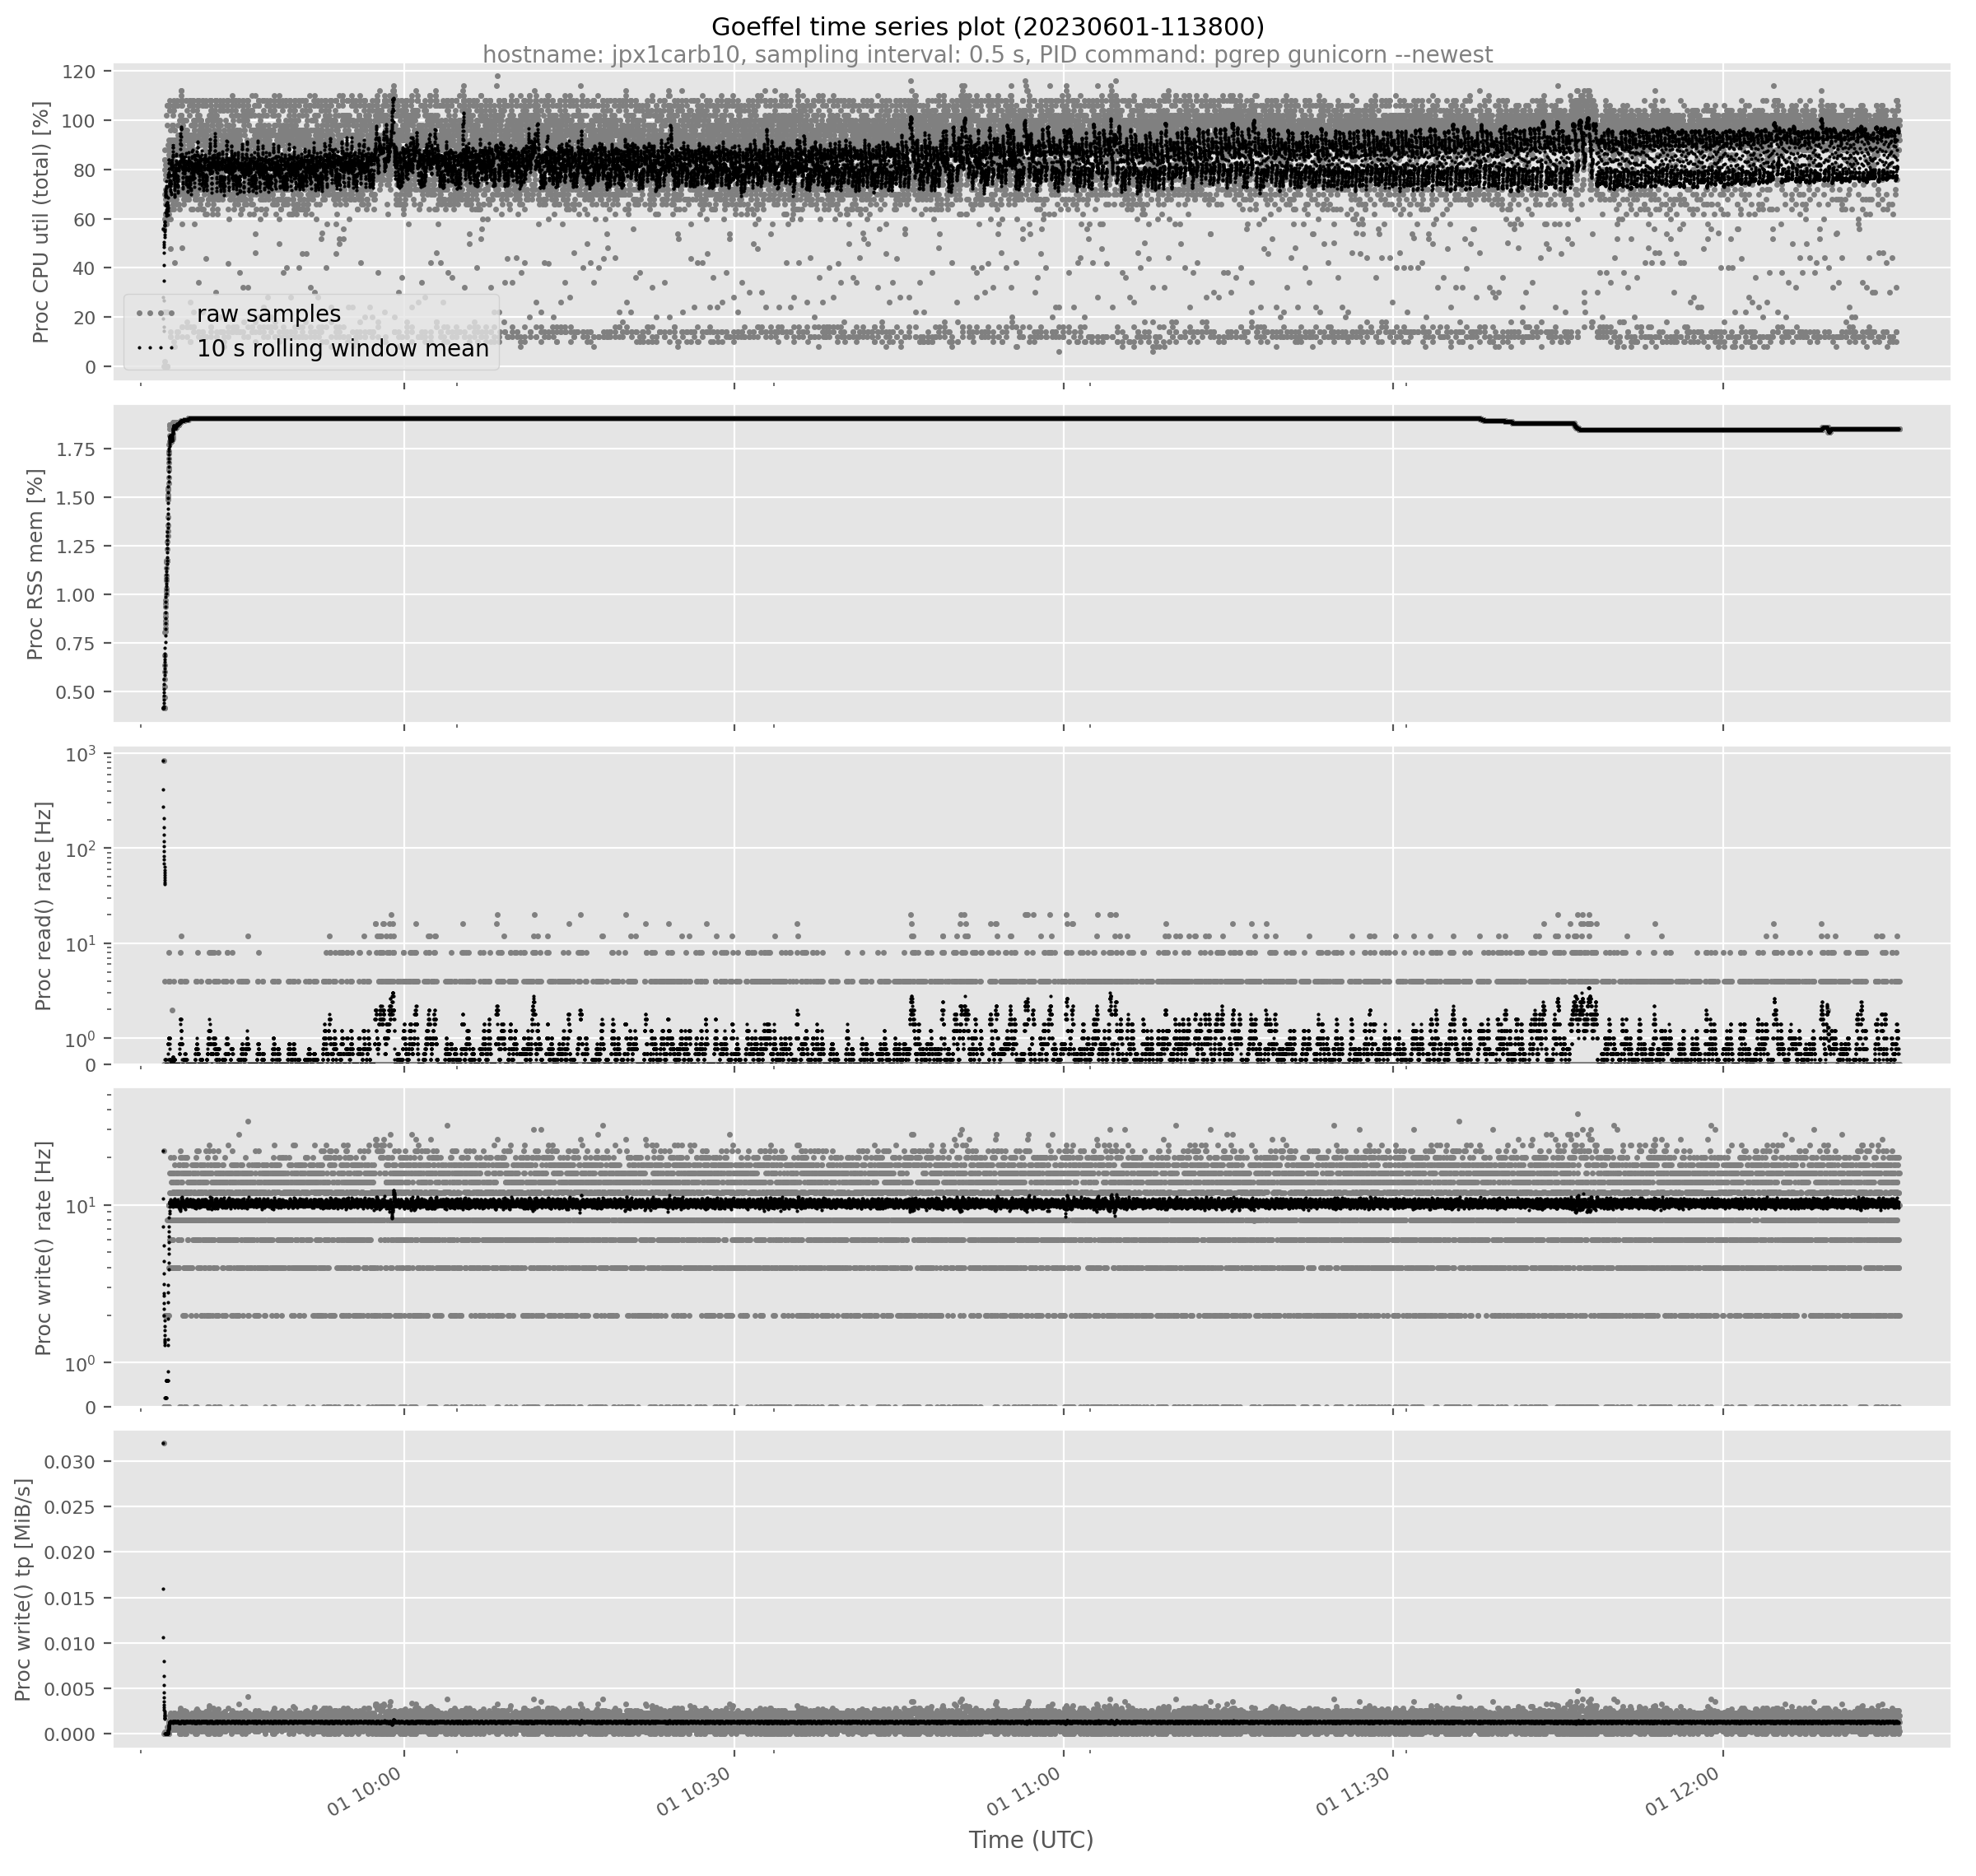
The second sub plot shows RSS over time. No memory leak in this case :-).
Leave a Reply